The Twelve Days of Box Office
Daily Box Office Analysis for December 21, 2010
By David Mumpower
December 22, 2010
The explanation for this is that while the movie industry may change dramatically over the course of just a few years, consumer behavior does not. We as a people celebrate the holidays in largely the same way each calendar cycle. If Christmas is on a Tuesday, we plan accordingly; if it’s on a Saturday, as is the case this year, we adapt to that, and so on. Independent of the movies themselves, movies are still consumed in the same patterns by their customer base. Long time readers know that this behavior holds for periods such as President’s Day, Martin Luther King Junior’s birthday, July 4th and the December holiday period. The last two mentioned in the previous sentence are a bit unique in that they are not automatically slotted on a weekend, meaning that their celebratory period can occur on any day of the week.
This behavior is exactly what makes the July 4th, Christmas Eve and New Year’s Eve box office days so fascinating. These are holidays during which people ordinarily have other plans such as parties, fireworks, drunken hook-ups, and travel. For over a decade now, BOP has preached about the x-factor of free time as an explanation for why movie box office revenue increases dramatically on holidays. When consumers make plans for other activities, they do not have that x-factor of free time that is requisite for movie-going. As such, those three holidays operate as box office anti-holidays in that revenue is down rather than up. Oddly, Christmas Day and New Year’s Day will not be adversely affected by such behavior and will in fact experience huge box office revenue.
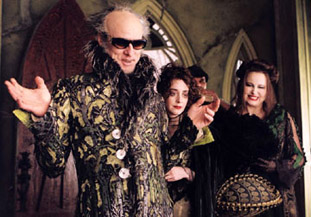
Now that you have the meta view of the situation, let’s circle back to the earlier Tron: Legacy data, tying in the 2004 Lemony Snickets model. That title earned $8.3 million on Sunday then fell 47.1% to $4.4 million on Monday then dropped again to $4.2 million on its first Tuesday in release. That Tuesday total reflects 50.6% of the movie’s Sunday earnings. The combined Monday/Tuesday total of $8.6 million represents 3.6% more than its Sunday single day box office of $8.3 million. As a reminder, the Tron data listed above was a Monday decline of 47.7% (almost identical to Lemony Snicket) then an increase of 5.8% on Tuesday (much better than the 4.5% drop of Lemony Snicket). The particularly noteworthy numbers are the Sunday-to-Tuesday retention rate of 55.3% for Tron: Legacy as opposed to 50.6% for Lemony Snicket. Similarly, Tron: Legacy’s 7.1% increase from Sunday to combined Monday/Tuesday revenue is better than the 3.6% experience by Lemony Snicket.
Thus far, we can draw two conclusions from the data available. The first is that Tron: Legacy is performing somewhat similarly to its 2004 blockbuster counterpart, Lemony’s Snickets A Series of Unfortunate Events. Its Monday behavior was eerily similar but then Tron: Legacy held up much better on Tuesday. This leads to the second point. After five days of box office, Tron: Legacy is outperforming its 2004 modeling. Is this a one day glitch or the beginning of a trend? The answer to that question will go a long way in determining whether Tron: Legacy becomes a domestic winner or remains what it appeared to be after its opening weekend, a draw for Disney relative to production budget.
Over the course of the next several days, we will evaluate all of the titles in wide release. Tomorrow’s column will have a different main topic, however, as the Little Fockers is released into theaters. This is the sequel to arguably the most popular comedy of all time, Meet the Fockers, a $279 million winner from…Christmas week of 2004.
|
|
Rank |
Film |
Studio |
Gross ($) |
Venues |
Per-Venue |
Percentage Decline |
Domestic Total |
|
1
|
Tron: Legacy
|
Walt Disney
|
$6,350,783
|
3451
|
$1,840
|
+5.8
|
$56,379,798
|
|
2
|
Yogi Bear
|
Warner Bros.
|
$2,948,354
|
3515
|
$839
|
+16.6
|
$21,788,141
|
|
3
|
The Chronicles of Narnia: The Voyage of the Dawn Treader
|
Fox
|
$2,660,104
|
3555
|
$748
|
+19.6
|
$47,637,400
|
|
4
|
Tangled
|
Walt Disney
|
$2,462,425
|
3201
|
$769
|
+23.8
|
$132,369,375
|
|
5
|
The Fighter
|
Paramount
|
$1,903,048
|
2503
|
$760
|
+17.5
|
$16,092,257
|
|
6
|
Black Swan
|
Fox Searchlight
|
$1,593,300
|
959
|
$1,661
|
+6.4
|
$18,882,177
|
|
7
|
The Tourist
|
Sony
|
$1,467,036
|
2756
|
$532
|
+20.2
|
$33,301,501
|
|
8
|
How Do You Know
|
Sony
|
$1,197,326
|
2483
|
$482
|
+12.8
|
$9,743,996
|
|
9
|
Harry Potter and the Deathly Hallows Part I
|
Warner Bros.
|
$1,122,149
|
2860
|
$392
|
+16.5
|
$267,808,784
|
|
10
|
Burlesque
|
Sony
|
$337,799
|
1510
|
$224
|
+14.0
|
$36,171,798
|
|
|
|
|
|
|
|
|
|
Continued:
1
2
|
|
|
|


